🐥 Web/🎨 Front-end
[SciChart] Vanilla Javascript에서 SciChart 사용하기
darly213
2023. 11. 17. 16:17
728x90
Javascript에서 SciChart 사용하기
script를 가져오고 미리 필요한 것들 정의하기
<script src="https://cdn.jsdelivr.net/npm/scichart/index.min.js" crossorigin="anonymous"></script>
...

const {
    SciChartSurface,
    NumericAxis,
    DateTimeNumericAxis,
    FastLineRenderableSeries,
    XyDataSeries,
    XyScatterRenderableSeries,
    EllipsePointMarker,
    EZoomState,
    SweepAnimation,
    SciChartJsNavyTheme,
    RolloverModifier,
    RubberBandXyZoomModifier,
    NumberRange,
    LegendModifier,
    MouseWheelZoomModifier,
    ZoomPanModifier,
    ZoomExtentsModifier
  } = SciChart;
A. SciChart 동작
- schiChartSurface 객체 위에 차트 데이터 시리즈가 올라가는 형태
// id = html selector
const { sciChartSurface, wasmContext } = await SciChartSurface.create(id);
1. xAxis와 yAxis로 데이터 타입 선택
const xAxis = new DateTimeNumericAxis(wasmContext);
const yAxis = new NumericAxis(wasmContext);
sciChartSurface.xAxes.add(xAxis);
sciChartSurface.yAxes.add(yAxis);
2. y로 들어갈 데이터 시리즈 생성
- 각자 원하는 차트에 따라서 선택하면 됨. 이 경우 lineseries
const lineSeries = new FastLineRenderableSeries(wasmContext, { stroke: "#F45B5B", strokeThickness: 4 });
sciChartSurface.renderableSeries.add(lineSeries);
3. chart modifier
- 차트를 보기 쉽게 만들어주는 기능들 추가
- RolloverModifier : 마우스를 올리면 해당 위치 값 표시
Legend Modifier : 범례 표시
ZoomPanModifier + MouseWheelZoomModifier : 마우스 휠로 확대 / 축소
const tooltipModifier = new RolloverModifier(wasmContext);
sciChartSurface.chartModifiers.add(tooltipModifier);
sciChartSurface.chartModifiers.add(new LegendModifier({ showCheckboxes: true, margin: 1 }));
sciChartSurface.chartModifiers.add(new ZoomPanModifier(), new MouseWheelZoomModifier());
4. 생성한 데이터 시리즈에 데이터 추가
- 차트 타입 등에 맞는 데이터 추가
var data = new XyDataSeries(wasmContext, { dataSeriesName: "Server 1" });
lineSeries.dataSeries = data;
B. DB 데이터 추가 - 날짜 / 온도
- x data = 날짜(strf time)
- y data = 온도(degree celcius)
- jQuery + Ajax로 데이터 받아와서 추가
const drawChart = async	(rack, start) => {
    data = new XyDataSeries(wasmContext, { dataSeriesName: "Server 1" });
    $.ajax({
        url: `{your address}`,
        method: "GET",
        async: true,
        success: function (response) {
            var degrees = response;
            var date = new Date();
            if (degrees.length != 0) {
                degrees.forEach(function (el, index) {
                    date = new Date(el['time']);
                    time = date.getTime();
                    data.append(o.time / 1000 + 32400, el["temperature"]);
                })
            }
        },
        error: function (response) {
			alert("Get data failed");
        },
    });
    lineSeries.dataSeries = data;
}
C. DB 데이터 추가 - 실시간 업데이트
1. 각 차트 별 차트 객체 정의
- sciChartSurface , lineSeries, wasmcontext, data를 따로 관리
var chartOption = function (id, rack) {
    this.id = id;
    this.rack = rack;
    this.time = 0;

    this.sciChartSurface = null;
    this.wasmContext = null;

    this.lineSeries = null;

    this.data = null;
}
2. draw chart를 처음에만 단독 실행하도록 구현
const drawChart = async	(option, start) => {
    var o = option;
    if (o.data == null){ // data가 없을 때(초기상태)만 가져옴
        data1 = new XyDataSeries(wasmContext, { dataSeriesName: "Server 1" });
        $.ajax({
            url: `{your address}`,
            method: "GET",
            async: true,
            success: function (response) {
                var degrees = response;
                var date = new Date();
                if (degrees.length != 0) {
                    degrees.forEach(function (el, index) {
                        date = new Date(el['time']);
                        time = date.getTime();
                        data1.append(o.time / 1000 + 32400, el["temperature"]);
                    })
                }
            },
            error: function (response) {
				alert("Get data failed");
            },
        });
    }
    // 데이터가 이미 존재하면 추가된 데이터를 dataseries에 반영 -> 자동 업데이트 됨
    o.lineSeries1.dataSeries = o.data;
}
3. update chart를 활용해서 데이터 업데이트
- draw chart에서 series에 전달만
const updateChart = (option, start) => {
  var o = option;
  $.ajax({
	  url: `{your address}`,
	  method: "GET",
	  async: true,
	  success: function (response) {
		var degrees = response;
		if (degrees.length != 0) {
		  degrees.forEach(function (el, index) {
			var new_date = new Date(el['time']);
			var new_time = new_date.getTime();
			if (new_time > o.time) {
			  o.data.append(new_time / 1000 + 32400, el["temperature"]);
			  o.time = new_time;
			}
		  });
		}
	  },
	  error: function (response) {
		alert("Get data failed");
	  },
  });
  drawChart(o);
};
4. Document.ready -> 적용방법
$(document).ready(function($) {
    generateTempSurface(rack1Option).then(function (option) {
        rack1Option = option;
        drawChart(rack1Option, day);
    });
    timer1 = setInterval(updateChart, 30000, rack1Option, day);
})
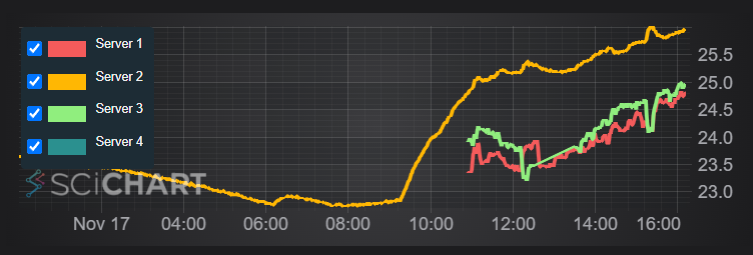
D. 결과
728x90